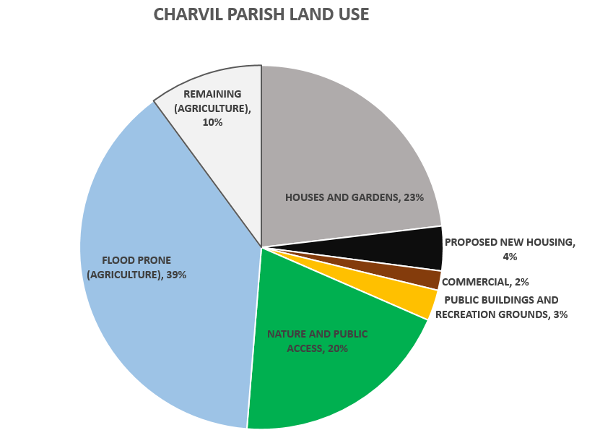
Despite its position on major thoroughfares and close to major population centres, the pie chart shows that Charvil has retained a generally rural character
This is probably because the majority of the parish area is subject to flooding (including the nature and public access segment shown)
It is also apparent that very little of the parish that is not subject to flooding now remains undeveloped (10% of the parish). This lies in north Charvil and to the south of the railway bridge
Existing public facilities and services are shown in the maps.
What do you think is missing? Complete the survey.
Charvil Geography & Demographics
The parish of Charvil covers an area of 354 hectares (approximately 875 acres). The parish from the Thames to the boundary with Hurst is approximately 2 ½ miles and on average 2/3rd of a mile wide. The parish represent about 2% of the geographic area of Wokingham.
According to the 2011 census the population of Charvil was 3042, (a 2016 estimate by the ONS revised this upwards to 3165) this represent 2% of the total population of Wokingham. The 2011 census also records there being 1131 dwellings within the parish forming 1097 households.
A summary of Key Demographic and Geographic Statistics are presented below in Table 1.
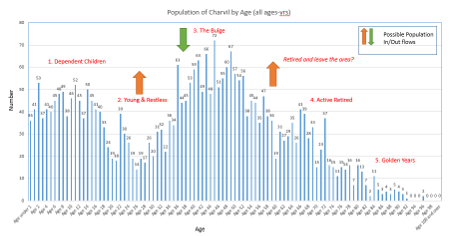
Three further graphs characterise the demographics of the village and further analysis based on the 2011 census.
Graph 1. Charvil population by age this graph presents the age distribution of the village in 2011 here we can potentially recognise various broad groups.
Graph 2. This presents the number of different household types in Charvil
Graph 3. This graph presents the ethnic make up of Charvil at the 2011 census